POSTS
Prometheus, the Patron of Observability
- 5 minutes read - 1026 wordsWhat is Prometheus?
Prometheus is a popular tool for metrics ingestion and querying. Ostensibly named for the titan Prometheus, the fire bringer and patron of the sciences, Prometheus is a great solution for infrastructure observability (illumination, if you will). It polls for metrics and hosts its own time-series database for advanced querying using PromQL. PromQL supports a number of features such as filtering via metric labels, aggregations over time intervals, and other filtering operators.
Prometheus Versus Other Solutions
It’s different from a solution like Nagios or DataDog in that it is pull-based rather than push-based. Rather than a metrics-source pushing its metrics to a central location via some sort of agent running on a server, Prometheus pulls metrics into itself by hitting an HTTP endpoint.
Data Ingestion
Prometheus expects to interact with various exporters that export data about a metrics-source by exposing an HTTP endpoint. There are many pre-defined exporters that work with Prometheus to do this. In the case of a node, we can use a node_exporter, which exposes various server metrics in a way that can be consumed by Prometheus. It looks something like:
node_cpu_guest_seconds_total{cpu="0",mode="nice"} 0
node_cpu_guest_seconds_total{cpu="0",mode="user"} 0
node_cpu_guest_seconds_total{cpu="2",mode="nice"} 0
node_cpu_guest_seconds_total{cpu="2",mode="user"} 0
# HELP node_cpu_seconds_total Seconds the cpus spent in each mode.
# TYPE node_cpu_seconds_total counter
node_cpu_seconds_total{cpu="0",mode="idle"} 158088.84
node_cpu_seconds_total{cpu="0",mode="iowait"} 11.12
node_cpu_seconds_total{cpu="1",mode="iowait"} 25.36
node_cpu_seconds_total{cpu="1",mode="nice"} 2.5
node_cpu_seconds_total{cpu="1",mode="softirq"} 145.59
There are Prometheus client libraries for a number of languages that make defining and exporting these types of metrics easier, including clients for Java and Python.
Querying Prometheus
Prometheus is queried via PromQL. Filtering by label can be done by using curly braces, label names, then either exact values or regular expressions. For example, to get the CPU time spent idle, we can use the query.
node_cpu_seconds_total{mode="idle"}
We sum by node by using the sum by operator, grouping
by the instance label, which should be unique per node.
sum by(instance)(node_cpu_seconds_total{mode="idle"})
We can also get the rate of increase of idle time by instance
by adding the
range vector selector
and
rate
function to our query.
sum by(instance)(rate(node_cpu_seconds_total{mode="idle"}[5m]))
Useful Prometheus Queries
Although it’s difficult at first to get started with PromQL, you can get a headstart by integrating Grafana with Prometheus (see the next section). Once you have integrated Grafana, you can import Grafana dashboards that others have made, then examine the PromQL that they’ve used to generate their graphs. This will help a lot in understanding not only how to build your own Grafana visualizations, but also how to build PromQL queries for other purposes including alerting.
Indeed, the most useful queries are the ones that can be used for alerting, primarily to avoid catastrophic problems such as running out of disk space or down services.
For example, to find disks that only have 5% of free space available (using metrics from a node exporter):
node_filesystem_free_bytes / node_filesystem_size_bytes < .05
You may want to account for really big disks, so find disks that have less than 5% free disk and the free disk is below 5GB (or 5,000,000,000 bytes):
node_filesystem_free_bytes / node_filesystem_size_bytes < .05
  and node_filesystem_free_bytes < 5000000000
Using a load balancer such as HAProxy or ALB is not only a great practice to provide reliability, it’s handy as a monitoring endpoint. For example, if we are using HAProxy, we can expose its metrics using the haproxy_exporter (newer versions of HAProxy will have an exporter built-in). We can use HAProxy metrics as an early warning system that our services are misbehaving. We’ll typically have multiple backends supporting a single service endpoint. In HAProxy parlance, we have an HAProxy backend with multiple HAProxy servers. We can know whether an individual HAProxy server is down via the query:
haproxy_server_up == 0
When an HAProxy backend is down, it’s an even more serious problem because it means that each HAProxy server that defines a backend is unreachable, either because of connection or health check errors. We can query for this event as well.
haproxy_backend_up == 0
Setting up a Prometheus data source in Grafana
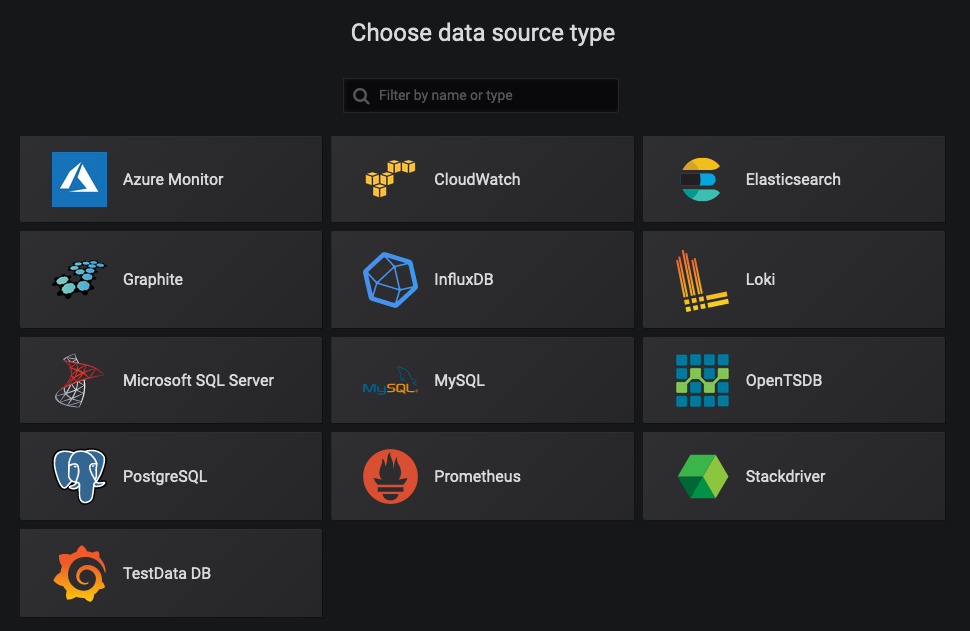
Assuming that you have a Grafana instance available, it’s easy to add a new Prometheus data source. Click the Configuration in the sidebar, then Add data source, then choose Prometheus as the data source type, then enter the URL of your Prometheus instance.

It’s also possible to automatically provision a datasource using a configuration file placed in a specific directory.
The file would look something like:
apiVersion: 1
deleteDatasources:
  - name: Prometheus
    orgId: 1

datasources:
  - name: Prometheus
    type: prometheus
    orgId: 1
    access: proxy
    url: http://myprometheus.example.org
    version: 1
Prometheus-backed Grafana Graphs
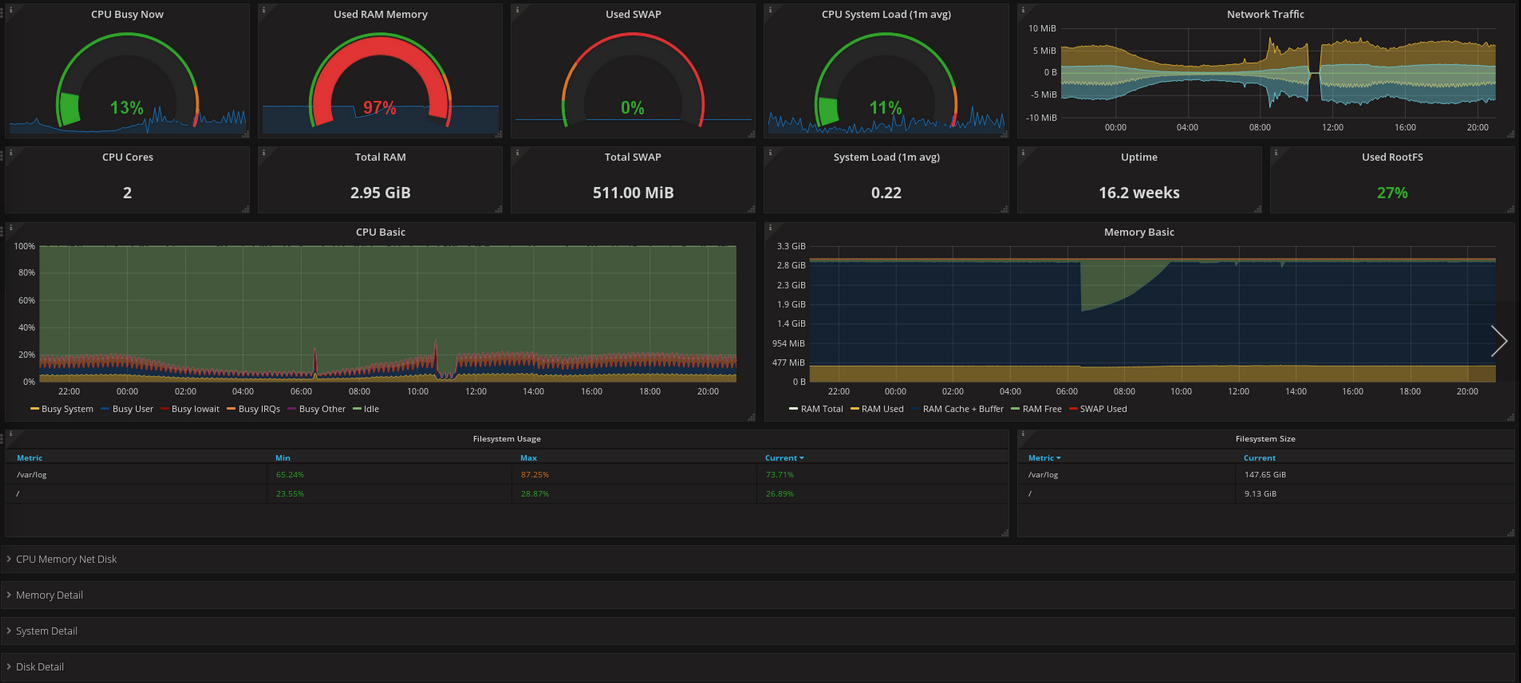
Once you’ve setup Prometheus as a datasource, you can import user-contributed dashboards from Grafana’s dashboard registry, such as Node Exporter Full, which will display metrics produced by the node exporter mentioned above.

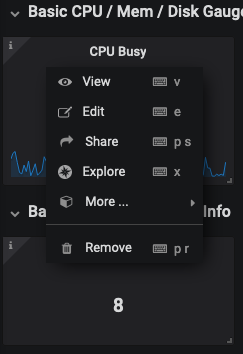
If you’re interested in the query that backs any of the graphs, you can click on the graph header to reveal a menu.

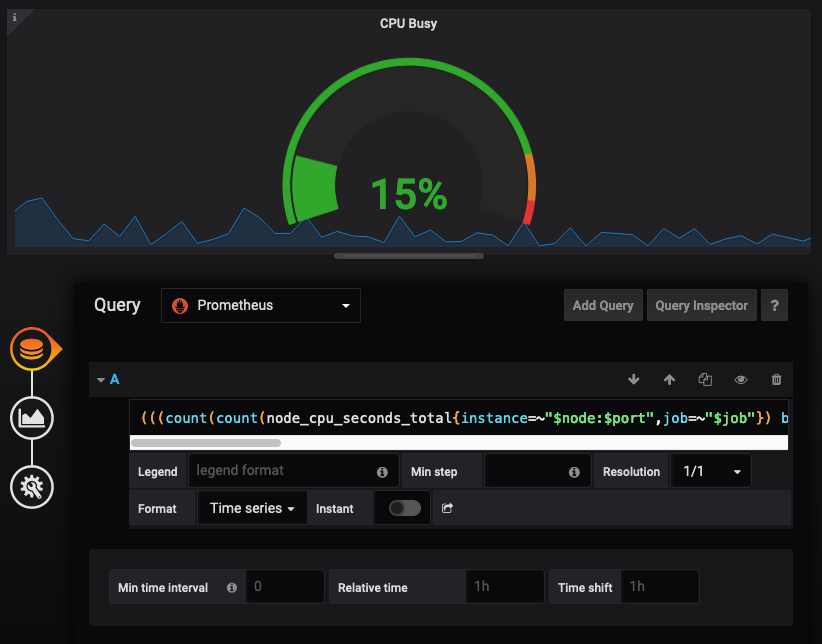
Select Edit to view the query and other graph options. This is also a great way to learn how to build your own Prometheus-backed graphs.

Alerting
While it’s common for alerting to be integrated directly into a monitoring solution as a monolith, Prometheus eschews this common pattern by separating it’s alerting component into a microservice called Alertmanager.
Users can configure one or more instances of Alertmanager in Prometheus to handle alerts, and Alertmanager can accept alerts from multiple Prometheus instances. Since Alertmanager provides a simple REST-based API, you could theoretically use it outside of Prometheus to issue alerts. Alertmanager supports sending alerts to various sources such as PagerDuty, e-mail, and arbitrary webhooks.
You may be interested in adding support for other services such as Twilio and Microsoft Teams. There are associated projects that can help there such as sachet, which connects Alertmanager to various messaging providers like Twilio, Pushbullet, and telegram, and prometheus-msteams, which connects Alertmanager to Microsoft Teams.
Conclusion
Prometheus is a great solution for monitoring. It integrates with a number of other software like Grafana and Alertmanager to provide visualizations and alerting. It has its own custom query language called PromQL supporting label-based filtering, time-ranged filtering, basic operations, and aggregations. Prometheus can become a critical part of your monitoring infrastructure, especially if you don’t use a service like DataDog.